
Overall revenue from online fundraising grew by 23% .
Online Charitable Giving Statistics Show Growth!!
Online giving grew 12.1% in 2017 (Aprii 2018)
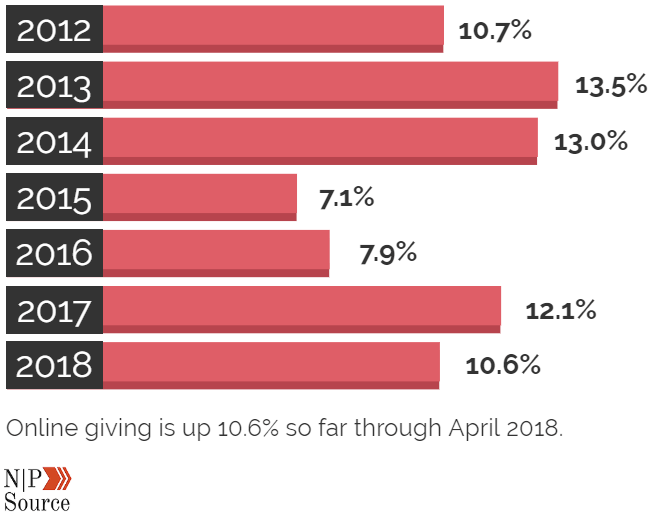
Online giving has seen consistent year over year growth:
- 2012: $19.2 billion
- 2013: $21.2 billion
- 2014: $24.1 billion
- 2015: $25.8 billion
- 2016: $27.8 billion
- 2017: $31 billion
- 54% of donors worldwide prefer to give online with a credit or debit card.
- 11% prefer direct mail.
- 11% prefer cash.
- 10% prefer bank/wire transfer.
- 9% prefer Paypal.
- 4% prefer mobile app/wallet.
- 1% prefer text message.
- $128 dollars is the average online donation amount.
- $326 dollars is the average annual donation total for recurring donors.
- 67% of nonprofits across the globe are set up to accept online donations.
- On December 31st, online giving is concentrated between 12 PM and 7 PM.
- On December 31%, online giving is concentrated between 12PM – 7PM.
- Custom-branded donation pages nested inside a nonprofit’s website raise 6X more money.

Online Fundraising Statistics
- Overall online revenue increased by 23% in 2017, accelerating from 15% growth the previous year.
- Every sector tracked saw at least 15% online revenue growth, with particularly large gains for Environmental (34%) and Rights (37%) nonprofits.
- Nonprofits received an average of 28% more online gifts in 2017 than 2016.
- On average, 38% of donors who made an online gift to a nonprofit in 2016 made an online gift again to that nonprofit in 2017.
- Retention was 25% for donors who made their first gift in 2016, and 60% for repeat donors (who gave at least one gift before 2016, and again in 2016).
- Revenue from one-time gifts increased by 19% in 2017.
- Remarketing on Facebook, Google Adsense, Twitter, or LinkedIn can increase traffic to your donation pages.
- In one case study, a nonprofit used Custom Facebook Audiences to drive 63% more online donations.
- Revenue from monthly giving grew 23% compared to 13% growth for one-time giving.
- Pre-selecting monthly giving on your donation page can increase conversions of monthly donations by up to 35%.
- Email messaging accounted for 26% of all online revenue.
- Live Chat Support increase audience engagement rates to drive 45% more opt-in conversions.
- For every 1,000 fundraising messages sent, nonprofits raised $42.
- There were noticeable differences in this metric by nonprofits’ size.
Small nonprofits (under 100,000 email subscribers) received $71 per 1,000 fundraising emails sent; Medium nonprofits (100,000–500,000 email subscribers) received $36;
Large nonprofits (over 500,000 subscribers) received $32.
- There were noticeable differences in this metric by nonprofits’ size.
General Online Giving Statistics
- Only 3% of charities rate their board and executive leadership as being digitally savvy.
- 66% of charities are worried they will miss out on opportunities for digital fundraising.
- Direct mail motivated 36% more donors to give online in 2016 compared to previous year.
- 51% of high-wealth donors ($200k+) prefer to give online.
- 34% of nonprofits have paid for advertising on social media.
- 21% of donations are directly through social.
Read More:
Giving Tuesday Statistics 2018
The next Giving Tuesday event will be held on December 03, 2018.
- Giving Tuesday raised $380 million dollars online, up 38% or $106 million from 2017.
- 14.2 billion social media impressions.
- 150+ countries participated in Giving Tuesday
Giving Tuesday continues to grow year over year:
- 2012: $10.1 million
- 2013: $28 million
- 2014: $45.7 million
- 2015: $116.7 million
- 2016: $168-$177 million
- 2017: $274 million
- 2019: $380 million
- Facebook raised more than $125 million for charity on Giving Tuesday, up 178% or $80 million from 2017.
Facebook and PayPal matched $7 million in donations to United States nonprofits Giving Tuesday. Up to $20,000 per donor and $250,000 per nonprofit. The largest Giving Tuesday payment processing platforms:
- Facebook: $125 million, up from $45 million (+178%) last year.
- PayPal: $98 million, up from $64 million (+53%) last year.
- Blackbaud: $62.6 million, up from $60.90 million (+2.80%) last year.
- Donor Perfect: $35.20 million processed in 2018.
- Classy: $15.40 million processed in 2018.
- 46% of donors worldwide have not heard of #GivingTuesday.
- The online average gift amounts exceeded $134.00.
- 17% of online donation form views were on a mobile device.
- Faith-based nonprofits now receive the largest percentage of #GivingTuesday online donations.
Top five issues discussed:
public& societal benefit, human services, education, health, environment&animals.
Nonprofit Website Engagement
- Nonprofits raised $1.13 per website visitor in 2017.
- International nonprofits raised the most, $4.11 per visitor, while the Rights sector had the lowest revenue per visitor at $0.31.
- Overall, 1.1% of website visitors made a donation, an increase of 18% over 2016.
- Website traffic declined slightly in 2017, with 1.4% fewer visitors per month.
- Half of nonprofit website traffic came from mobile and tablet users.
- Mobile accounted for 40% of all visitors, tablets for 10%, and desktop users made up the other 50%.
- The share of mobile traffic increased by 9% from 2016, while the share of visitors using desktop or laptop computer declined by 4%.
- Nonprofit homepages took an average of 3.181 seconds to load, while donation pages took 2.816 seconds to load.
Study Suggestion:
Monthly Giving Statistics
- 45% of donors enrolled in a monthly giving program.
- The average monthly online donation is $52 ($624 per year) compared to the average one-time gift of $128.
- Monthly giving revenue increased by 40% in 2017.
- Monthly giving accounted for 14% of all online revenue in 2016, and 16% of online revenue in 2017.
- Donors that set up recurring donations give 42% more annually, compared to one-time donations.
- 52% of Millennials are more likely to give monthly over a large one-time donation.

Online Crowdfunding Statistics
- 41% have donated to crowdfunding campaigns that benefit individuals.
- 16% of crowdfunders donate less money to NGOs, NPOs, & charities due to their financial support of crowdfunding campaigns.
- 14% of donors worldwide have created an online peer-to-peer fundraising campaign.
- $9,237.55 is the average amount a nonprofit crowdfunding campaign raises.
- $568 is the average amount individuals raise through crowdfunding.
- An average of 8 people donate to an individual crowdfunding campaign.
- The average donation size to a crowdfunding campaign is $66.
- 17% of crowdfunding donations are made on mobile devices.
- Campaigns that can gain 30% of their goal within the first week are more likely to succeed.
Social Media is a critical factor in crowdfunding success:
for every order of magnitude increase in Facebook friends (10, 100, 1000), the probability of success increases drastically (from 9%-, 20%, to 40%).
- Individuals ages 24-35 are much more likely to participate in crowdfunding campaigns; those over 45 are significantly less likely to back campaigns.
- There’s an average of a 35% increase in giving when there’s a crowdfunding thermometer.
- 62% of donors who give to crowdfunding campaigns are new to crowdfunding.
- 300-500; the average word count in the campaign description for projects that raise the most money.
- Campaign owners raise 3X more if they update supporters every 5 days.
- The average number of updates that a successful campaign owner posts is 4.
- Crowdfunding campaigns get 126% more donations when owners update supporters.
- Campaigns that are shared fewer than 2 times have a 97% chance of failure.
- Crowdfunding campaigns with personal videos raise 150% than those that don’t have videos.
- Over half of people who receive an email about a crowdfunding campaign made a donation.
source: Non_Profits Source Website


Write Your Comment